Monthly DX Beacon Chart at W6SI
This is a record of NCDXF Beacon received at W6SI station using FAROS 1.4 monitor software. There are 18 beacons throughout the world, it records each ham band between 20m to 10m bands, including WARC bands. Each row on the given beacon block represents the band, 20, 17, 15, 12 and 10 meters, from the bottom to the top. The chart shows the relative signal strength (S/N ratio) of the received beacon.
The horizontal time axis is in UTC, so in PST each chart covers 4PM previous day to 4PM of the indicated day. The color of the chart indicates the S/N ratio as decoded by the software, as shown in the right column. The dark gray is no reception; the light gray indicates no input, where FAROS did not receive any signals from the receiver, due to W6SI QRV (I do operate the station now and then), strong interferences, PC malfunctions, or some other causes.
Each square represents 10 second time the beacon is captured, so each column represents 10sec x 5 bands x 18 bcn = 15 minutes to cover all beacons for all bands.
April, 2015
| Sunday | Monday | Tuesday | Wednesday | Thursday | Friday | Saturday |
1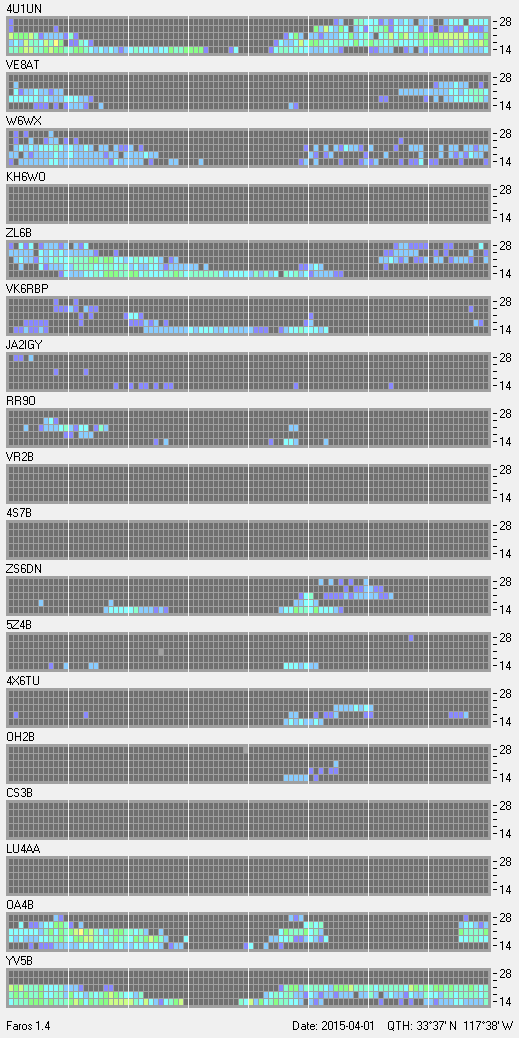 |
2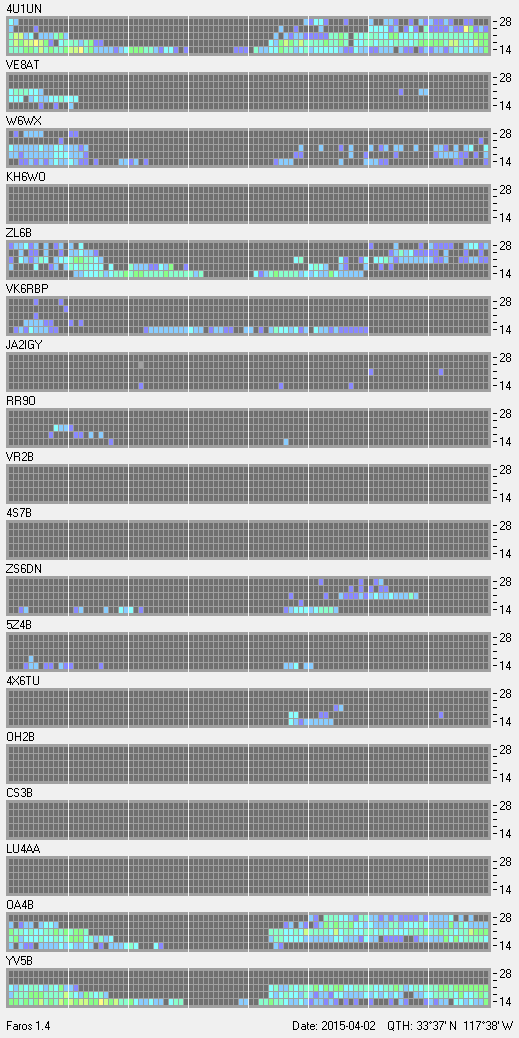 |
3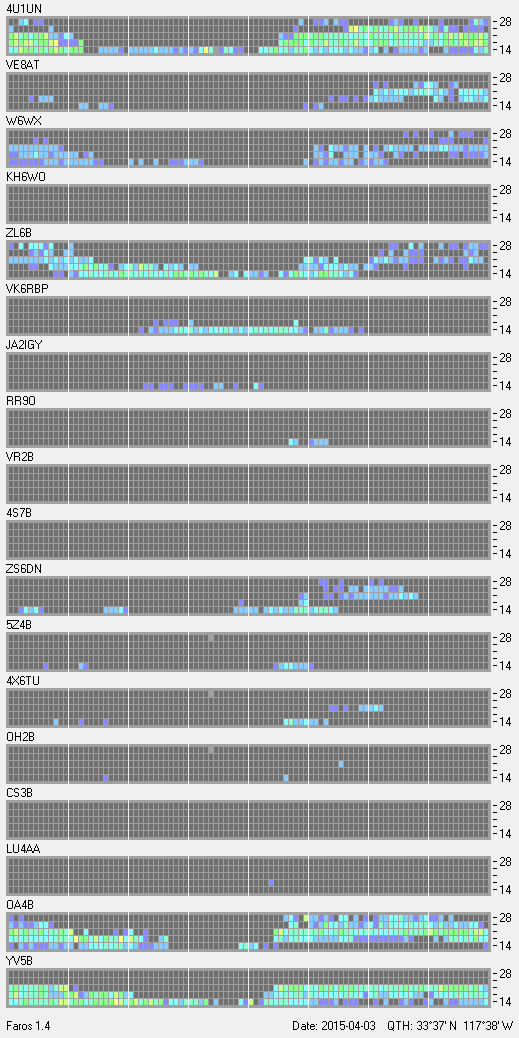 |
4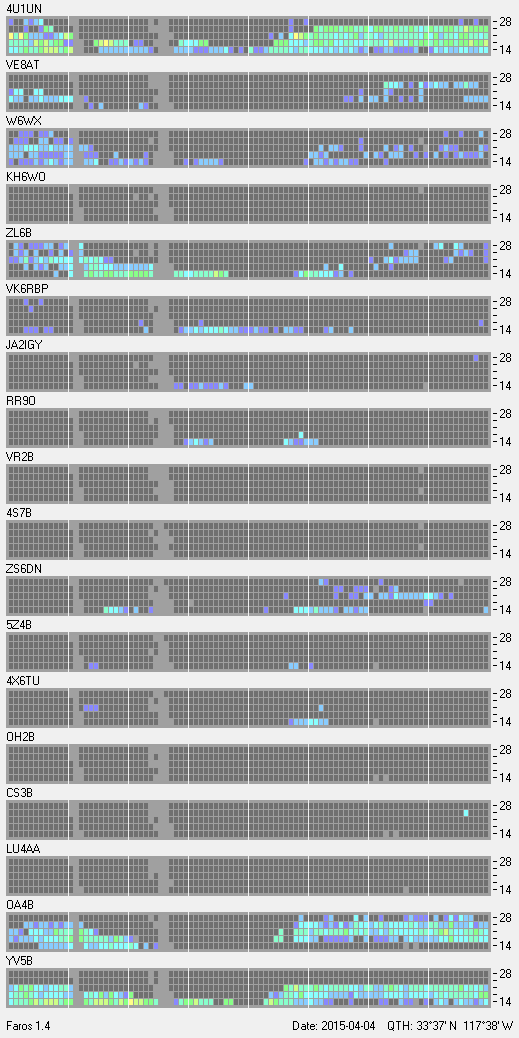 |
|||
5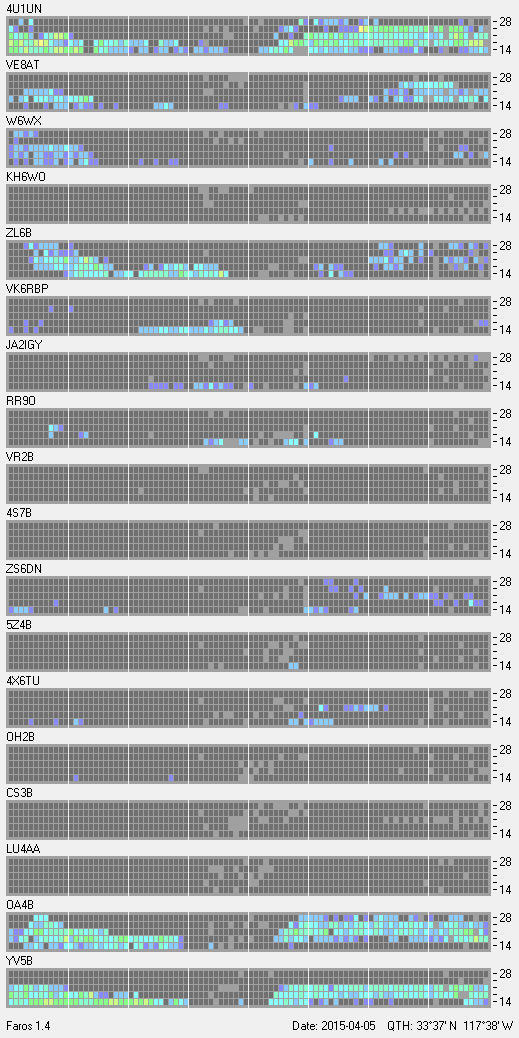 |
6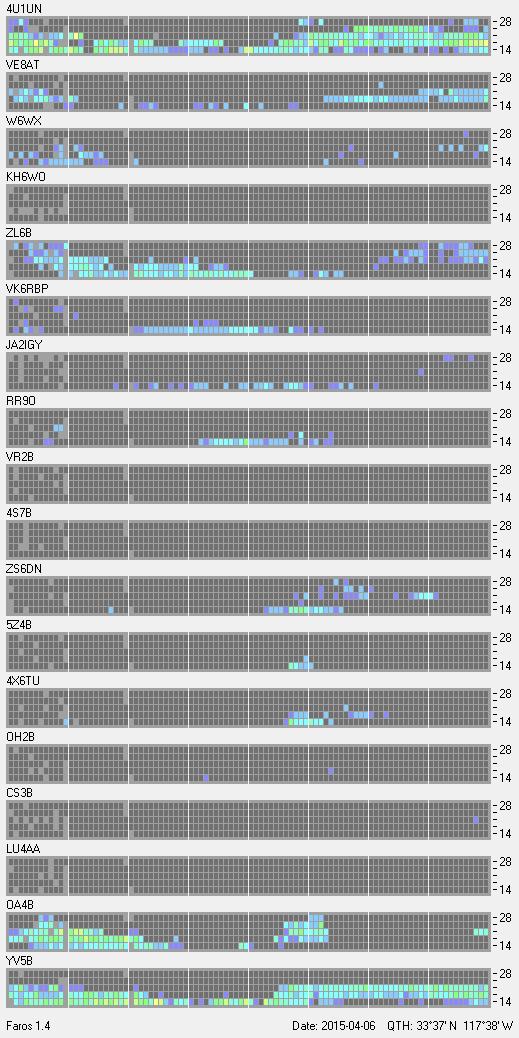 |
7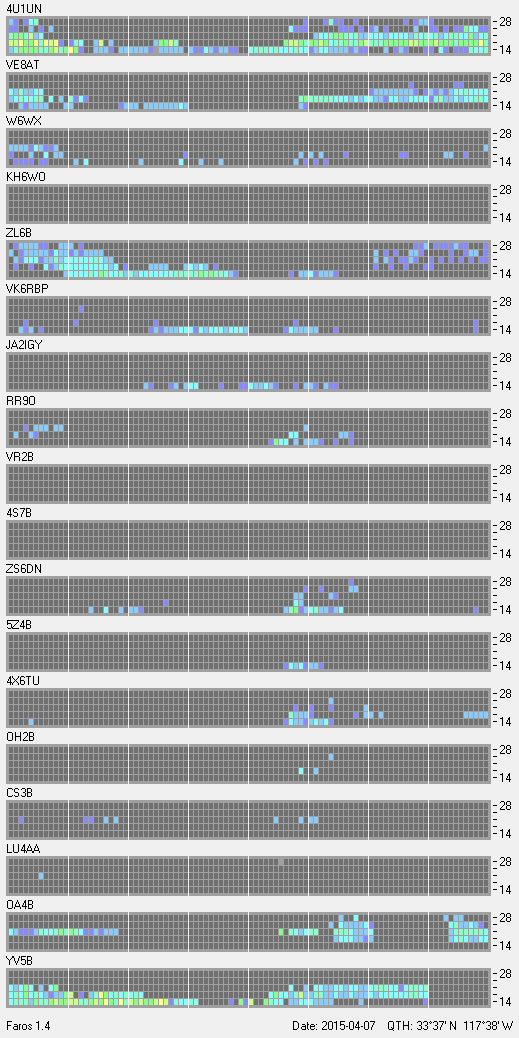 |
8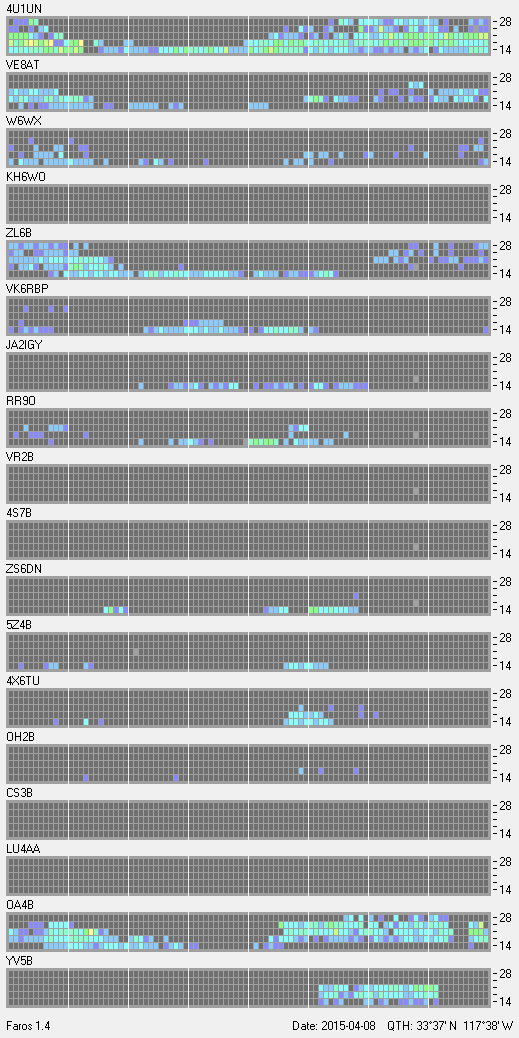 |
9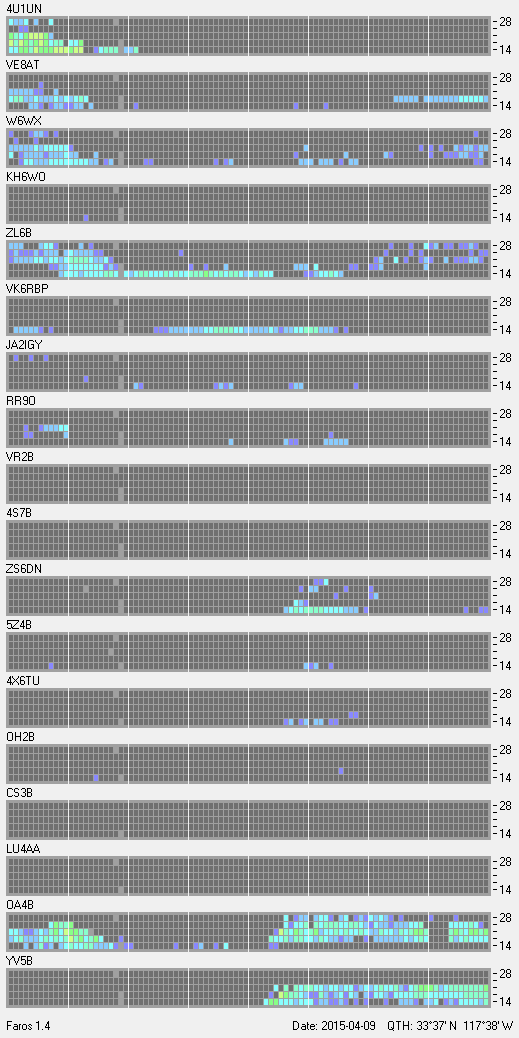 |
10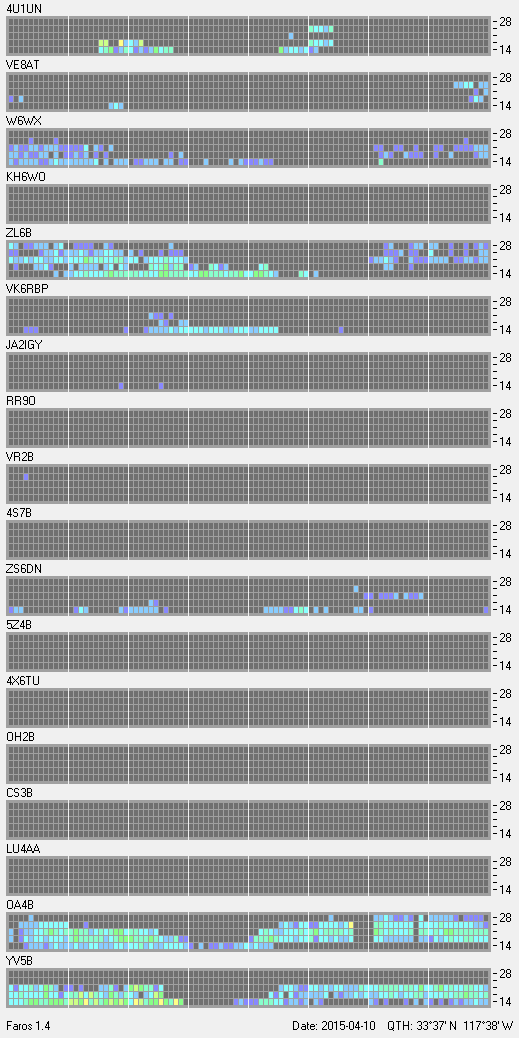 |
11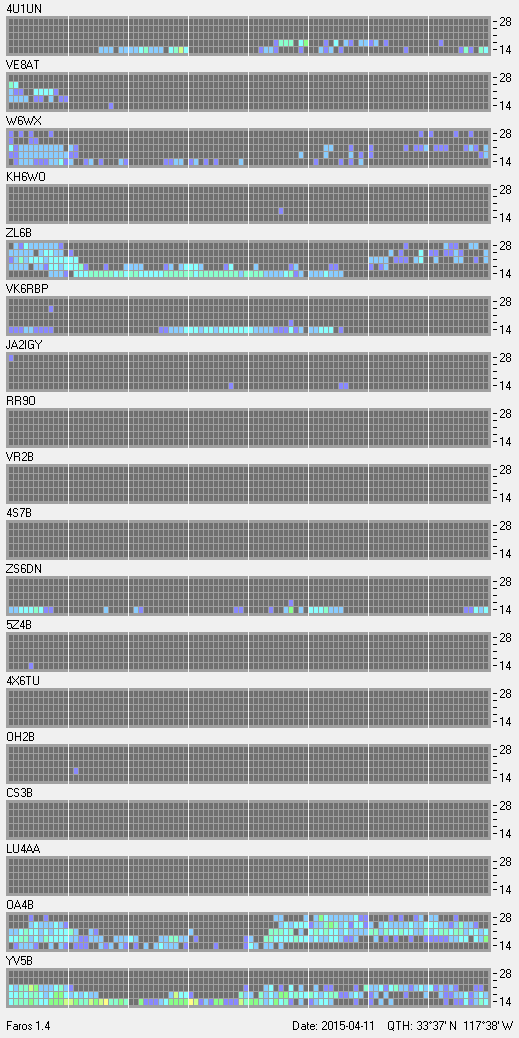 |
12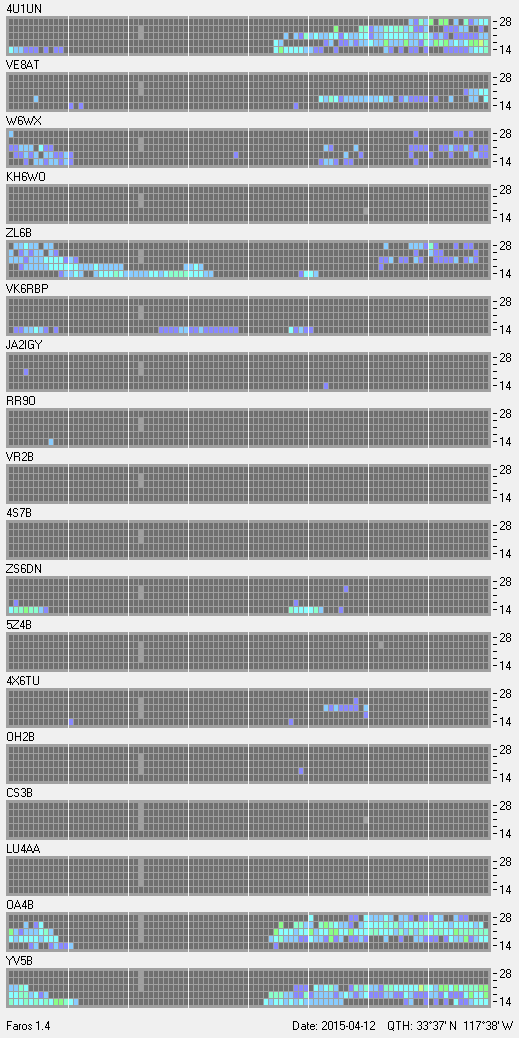 |
13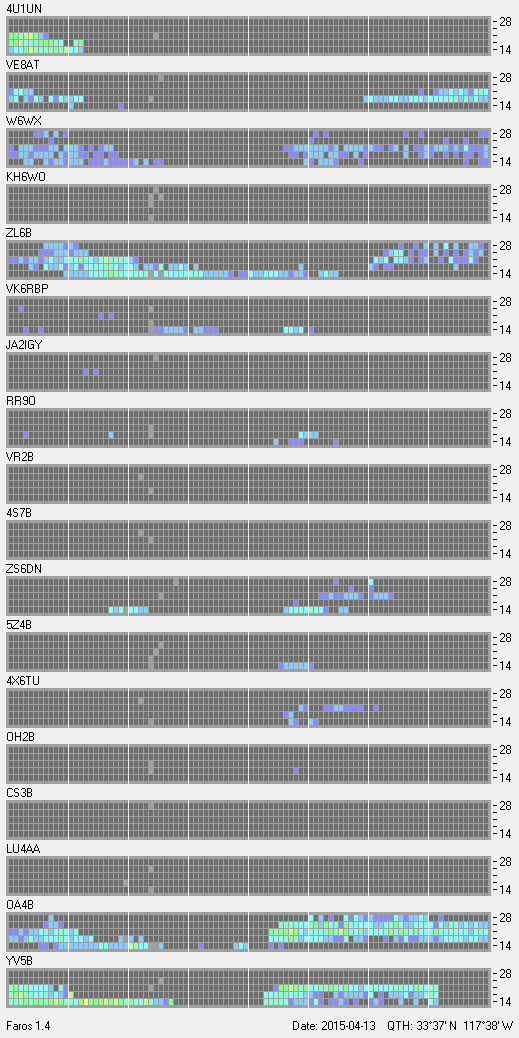 |
14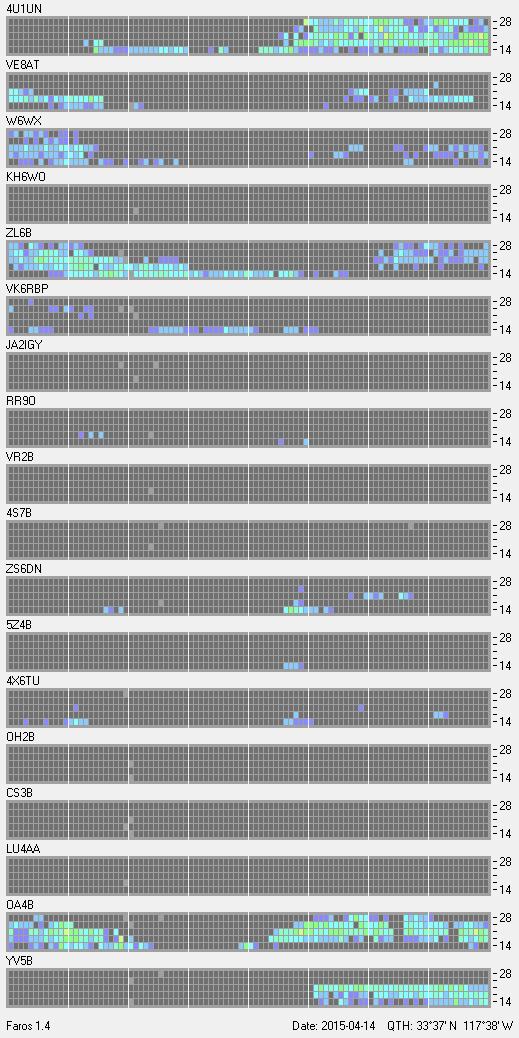 |
15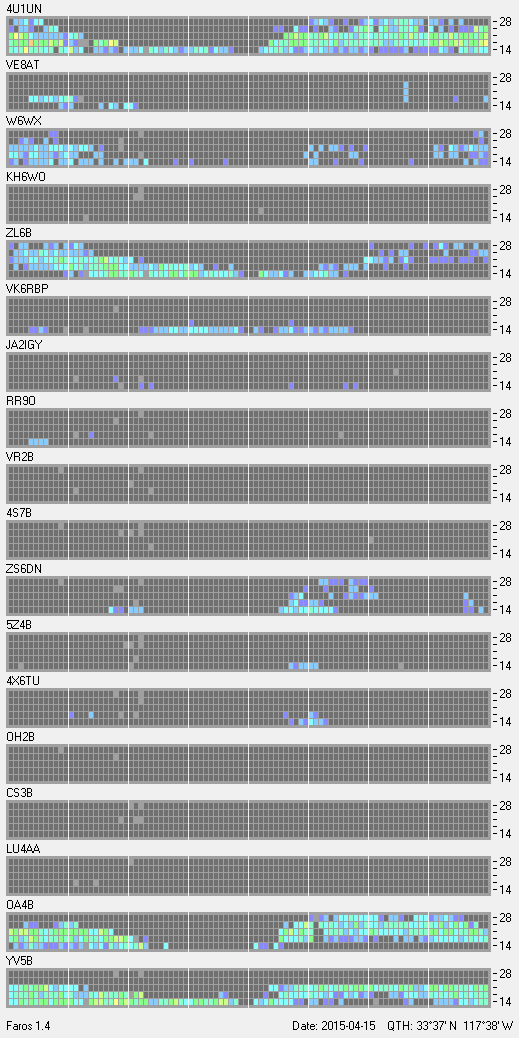 |
16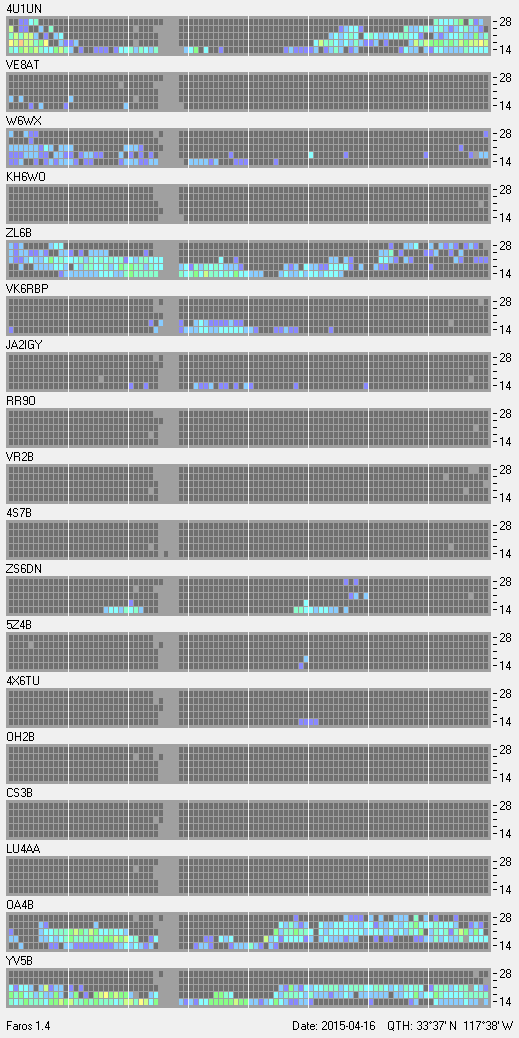 |
17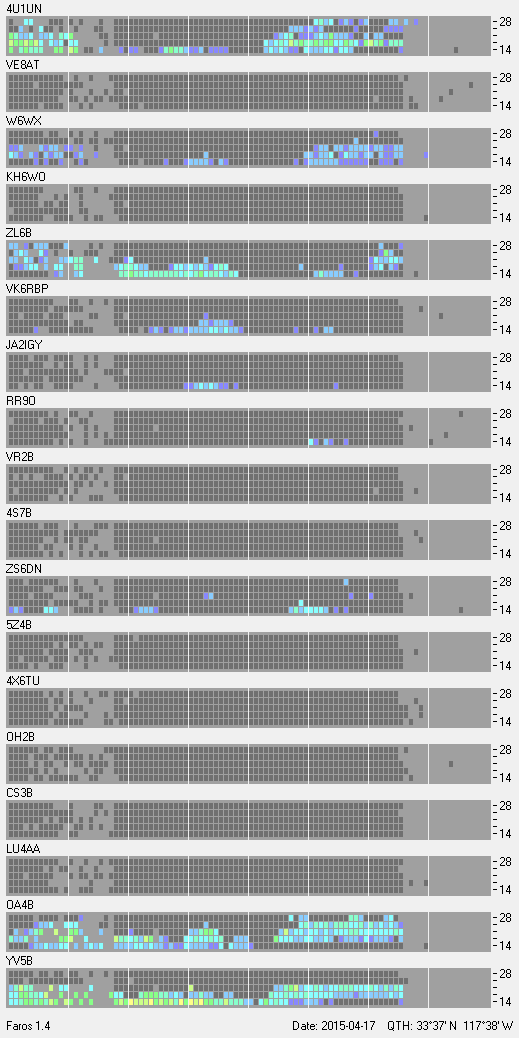 |
18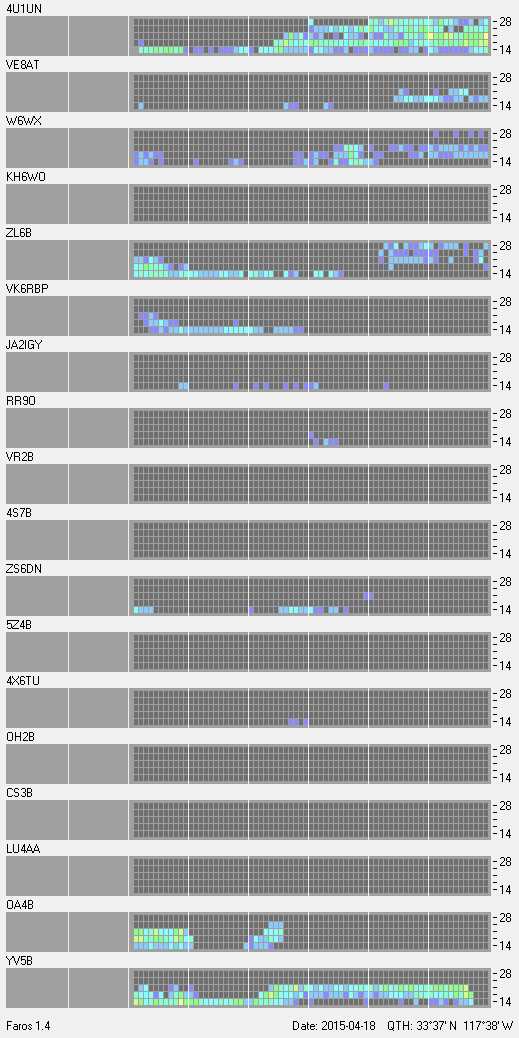 |
19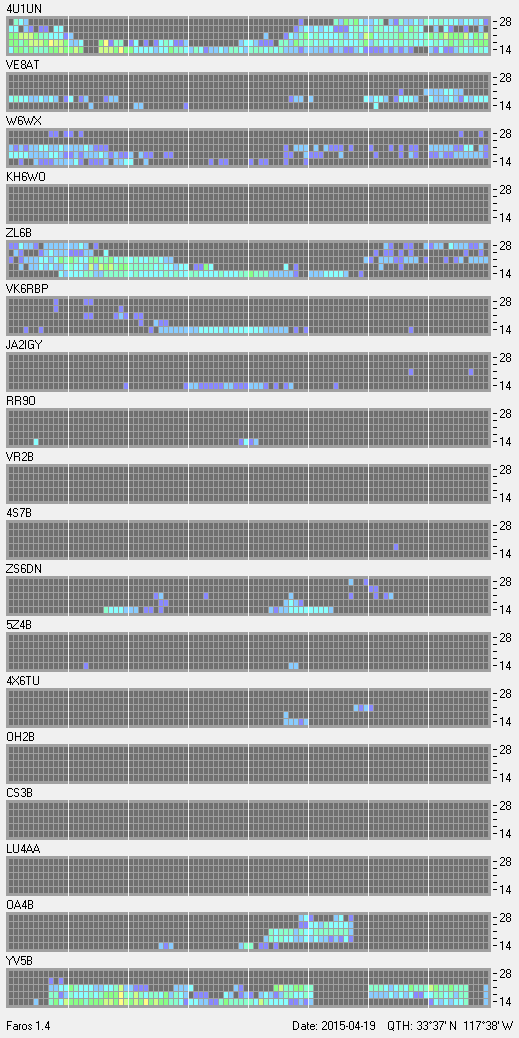 |
20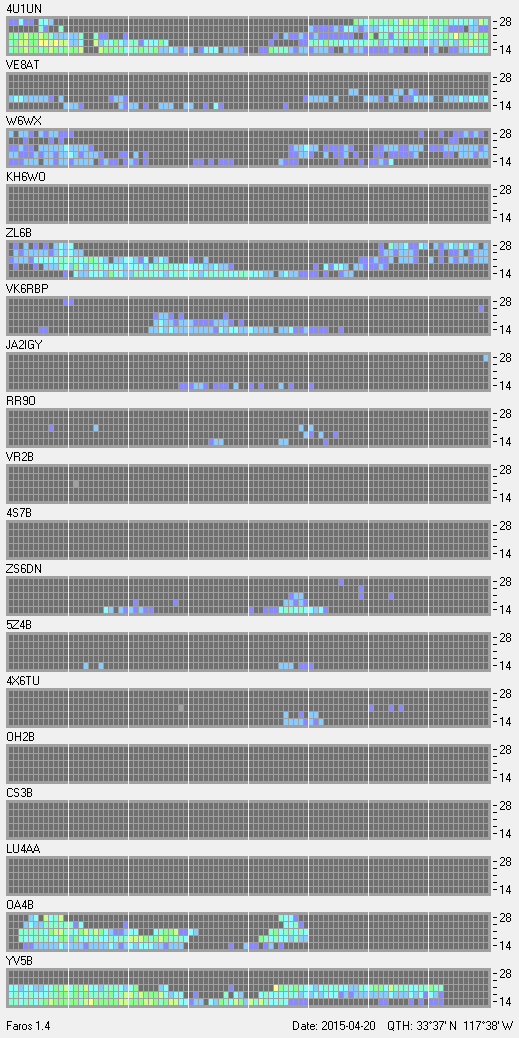 |
21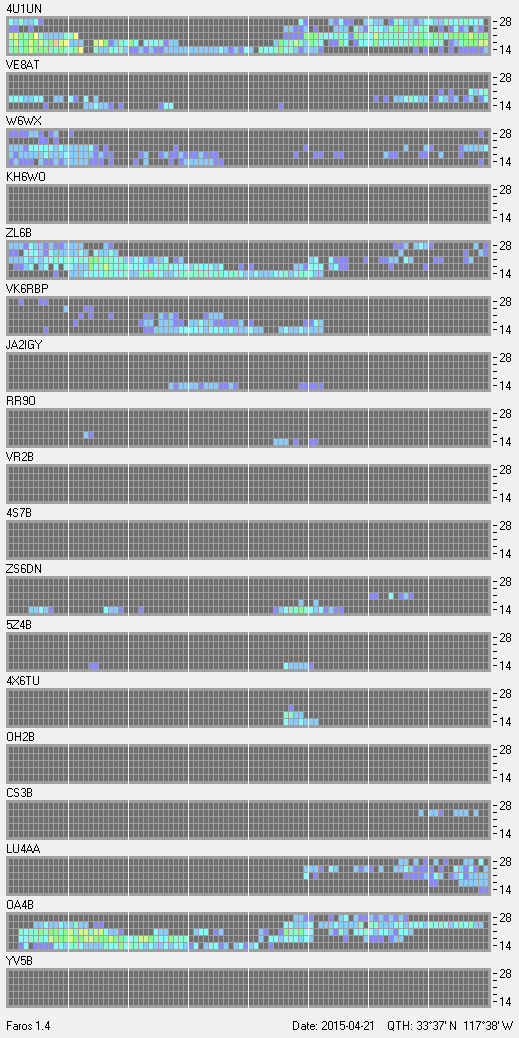 |
22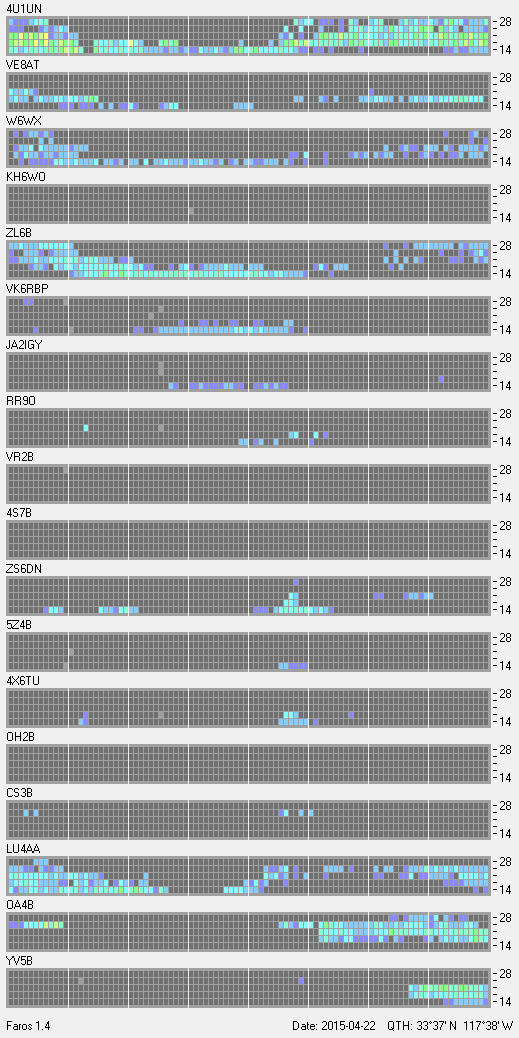 |
23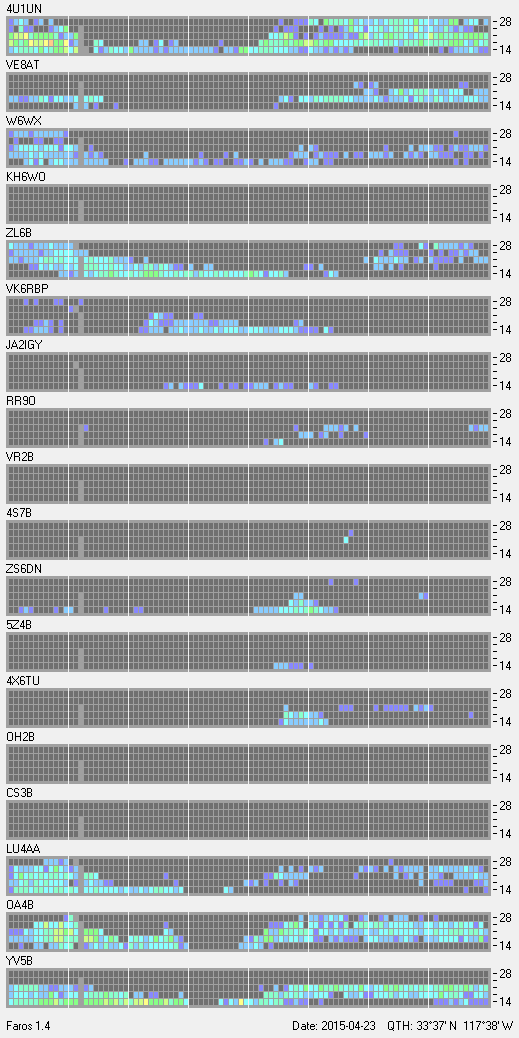 |
24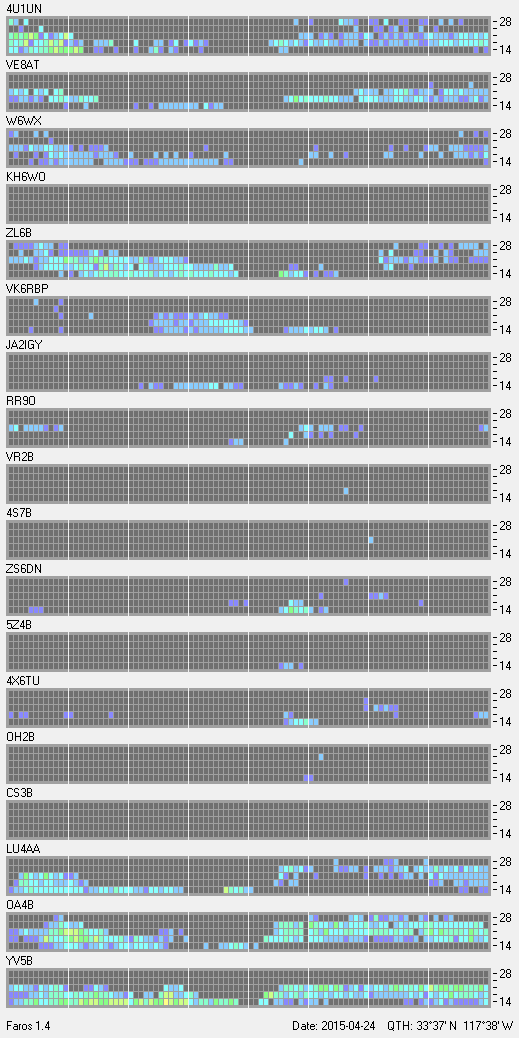 |
25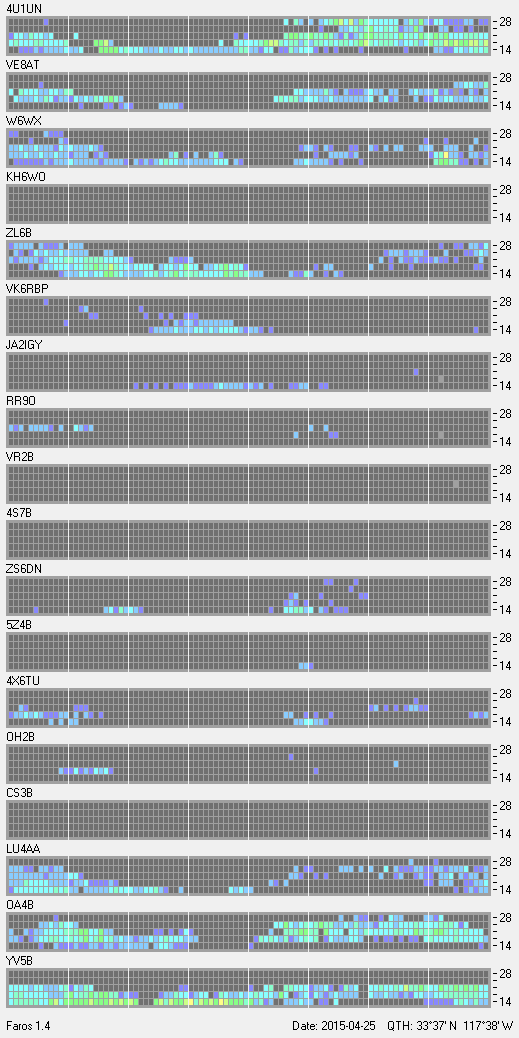 |
26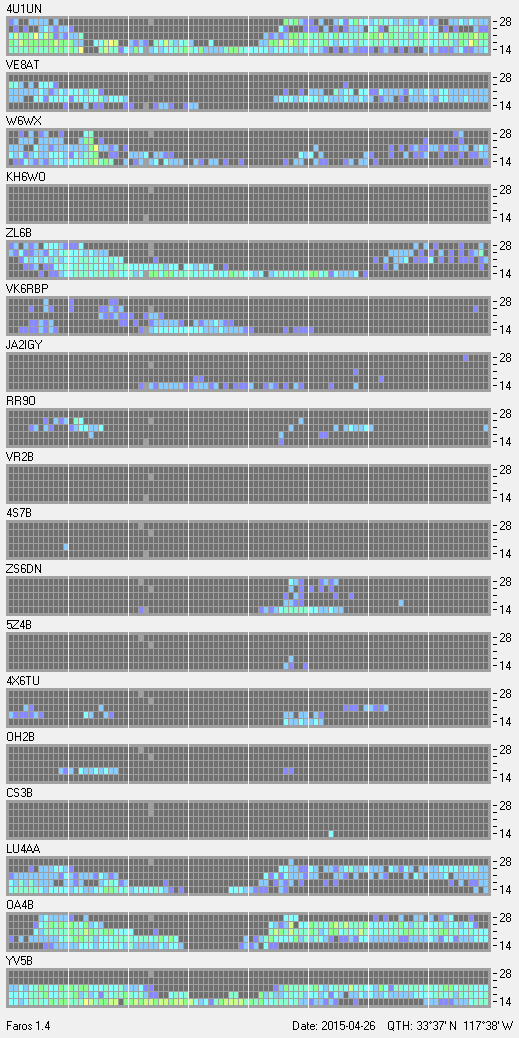 |
27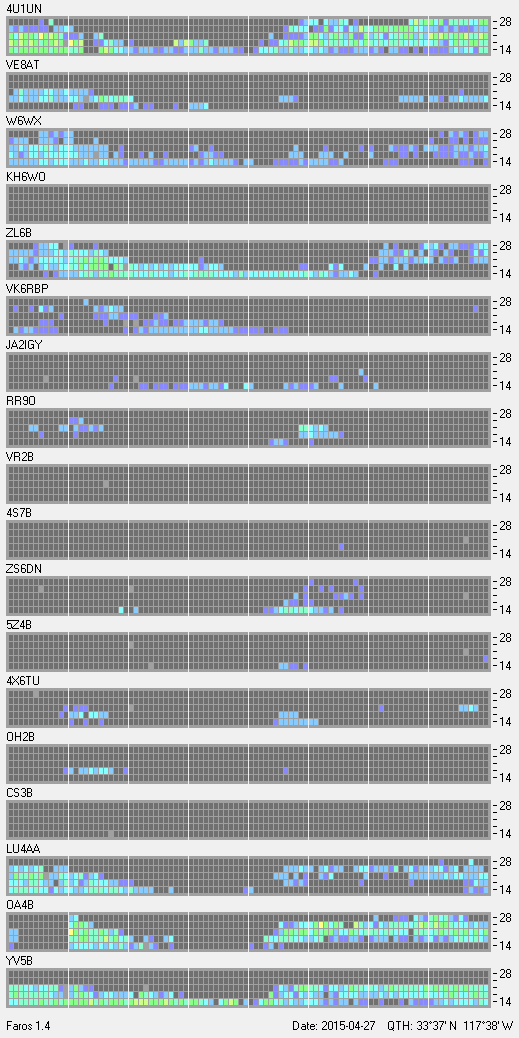 |
28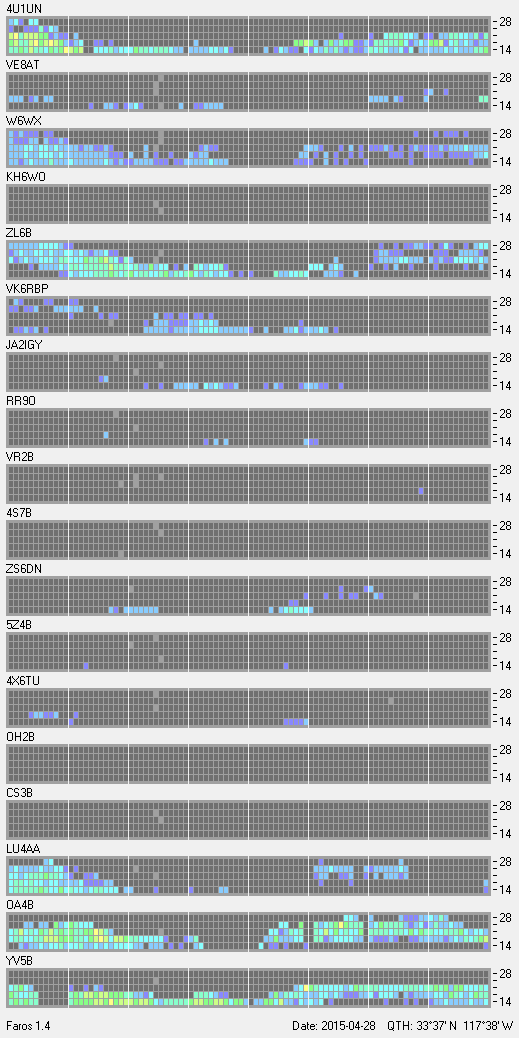 |
29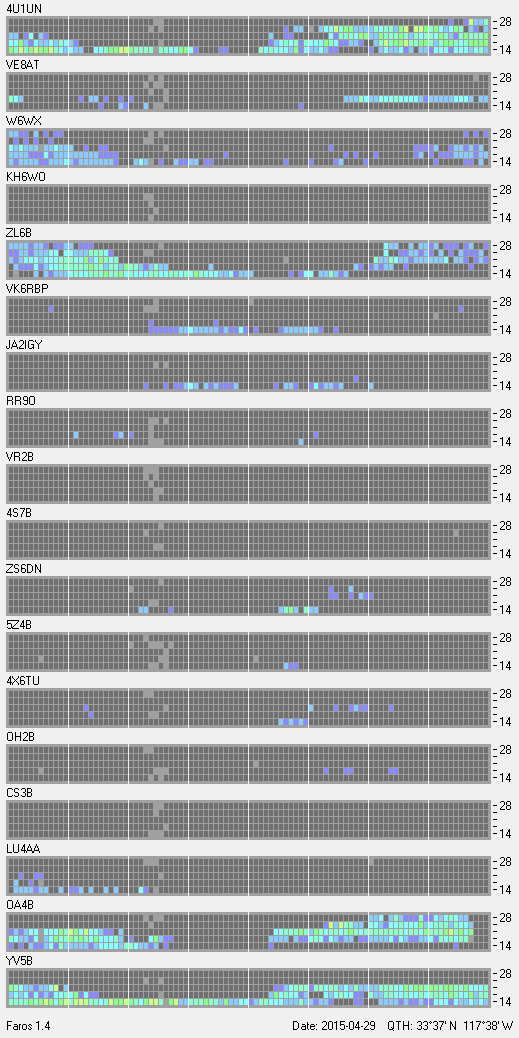 |
30 |
W6SI Beacon Monitoring Station Description:
ANT: MV Special vertical (see other parts of this web site)
RX: Elecraft KX3
Quadrature Audio output fed to Delta 44 Audio Card (32-bit, 96Ksmpl/sec)
PC: Dell GX755 PC Quad core @2.4GHz
(33deg 37min N, 117deg 38min W)
OS: Windows 7 (64-bit)
App: FAROS 1.4
Above is an archived data of the Beacon monitor, untouched by me. If you have any questions, feedback and/or suggestions, please send me an e-mail. I might reply on this page (sorry, no guarantee)